
In twenty years, Ñuñoa added 102.010 habitantes sin ganar un metro de territorio. Las torres multiplicaron a los vecinos, el presupuesto se multiplicó por 5 — y aun así, el presupuesto por habitante quedó below the country's median. This is the story of Ñuñoa told by its data.
Before the data, the land. The name comes from Mapudungun ñuñowe: “place of ñuños”, those yellow flowers of the Santiago countryside. Long before being the comuna of buildings, Ñuñoa was an Indian village, then colonial farmland, and only in the late 19th century, a municipality.
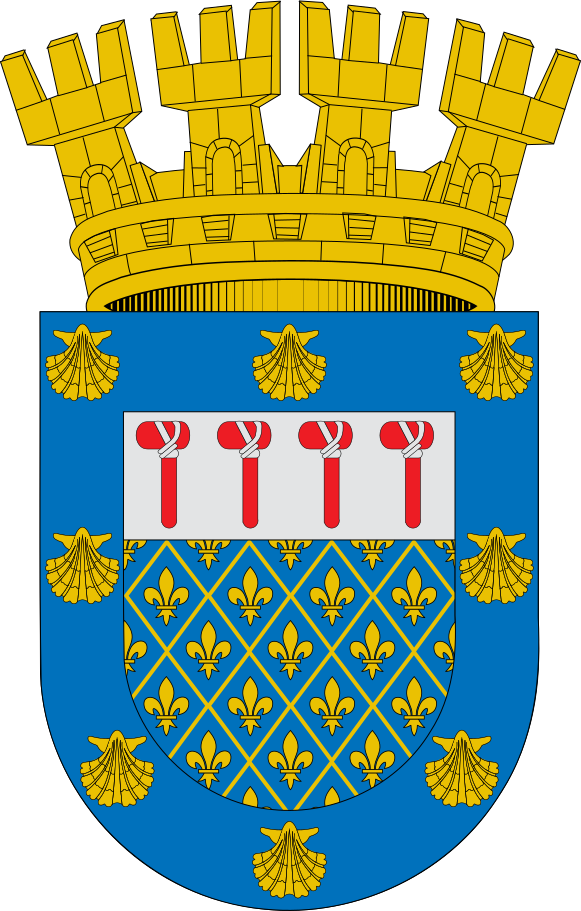
The coat of arms fuses Ñuñoa's two roots: the Spanish and the indigenous.
Blue field with golden fleurs-de-lis — the arms of Juan Jofré de Loaysa, the region's first Spanish encomendero (the same 1546 allotment).
Four red stone axes (toquis) — a tribute to the four original chiefs: Ñuñoa, Tobalaba, Macul and Peñalolén, natural lords of the land.
Eight golden shells on the bordure — taken from Santiago's coat of arms, for belonging to the city. Mural crown: that of every municipality in Chile.
Pedro de Valdivia distributes the lands of the the Indian village of Ñuñohue — whose cacique was Longomavico — among his companions. The first farm plots are formed.
The decree of December 22 creates the Municipality of Ñuñoa, with an enormous territory: it included Las Condes, Providencia, Apoquindo and even the Las Condes mine.
El May 6, by presidential decree, the comuna of Ñuñoa was born. It had 1,197 inhabitants, four schools, a post office and a Civil Registry. Its first mayor: Alejandro Chadwick.
From its own territory comes Providencia. Years later La Florida and others would do the same, at different times: Ñuñoa was the mother comuna of the eastern sector.
That comuna of 1,197 residents and blossoming trees — lilacs, jacarandas, cherry trees — is today one of 270 thousand inhabitants and towers. This is its story told by the data.
Ñuñoa is the laboratory of Chilean densification: a comuna of houses and squares that filled with buildings in two decades. Each new tower brings hundreds of residents who use the same squares, the same streets and the same municipality. The question that orders this story is simple: did the municipality have enough resources to grow at the pace of its people?
From 168.511 inhabitants to 270.521: the comuna filled with towers and new residents. Few comunas in Chile grew this fast without changing their boundaries.
From $17.878 million to $89.490 million a year (nominal). With only 8% dependence on the Common Fund: Ñuñoa almost funds itself.
Per resident, Ñuñoa has $330.807 a year — below the national median ($540.589). Growing upward multiplied residents faster than revenue.
The towers brought not only neighbors: they brought businesses. While the population grew, the number of companies domiciled in Ñuñoa nearly doubled in twenty years. The comuna stopped being purely residential and became also a place for starting businesses — and where three out of four homes are already apartments.
In fifteen years, Ñuñoa's homes nearly doubled —de 51.095 a 92.121— y las decenas de miles que se sumaron fueron, casi todas, upward: by 2017, 75 de cada 100 eran departamentos. La comuna de casas y antejardines se volvió una comuna de torres.
El suelo no vale lo mismo en toda la comuna. Cada polígono es una manzana real del catastro del SII, coloreada por el valor comercial de su terreno. Mueve el thermometer de más barato a más caro: verás cómo el suelo caro se concentra en los ejes y el borde norte de Ñuñoa, y cómo la trama se abarata hacia el sur.
A comuna's numbers say little without context. Placed alongside the other 345, Ñuñoa stops being an isolated case and becomes a a dot in a distribution: sometimes above, sometimes below. Each dot in what follows is a comuna; the big, highlighted one is Ñuñoa.
Out of every 100 comunas in Chile, 87 tienen más presupuesto por habitante que Ñuñoa. Su densidad explica buena parte: muchos vecinos repartiéndose un presupuesto que, en total, es grande — pero por cabeza, no.
Ñuñoa has 5 campuses of higher education in its own territory — it sits in the zero-distance group, while hundreds of comunas lie tens or hundreds of kilometers from the nearest university.
Con 7 especies amenazadas documentadas, Ñuñoa queda en el percentil 15: es una comuna urbana consolidada, lejos de los frentes de intervención territorial donde se concentra la pérdida de biodiversidad.
La paradoja de Ñuñoa se ve mejor al lado de sus vecinas. Las Condes juega en otra liga por habitante; La Pintana y Puente Alto, con mucha más gente que presupuesto, quedan abajo. Ñuñoa sails in the middle — far from the eastern sector's luxury, but also far from the periphery's hardship.
Otra forma de mirar la misma historia: seguir a Ñuñoa año a año en dos ejes a la vez —cuánta gente tiene y cuánto presupuesto—. Si el presupuesto creciera al mismo ritmo que la población, la trayectoria subiría en diagonal. Look at the shape of the curve: it says who won the race.
¿De dónde sale ese presupuesto que se multiplicó por cinco? Casi toda de la propia comuna: patentes, permisos de circulación e ingresos propios. El Fondo Común Municipal —la bolsa con que el Estado nivela a las comunas pobres— apenas asoma. Ñuñoa gives the system more than it gets.
Todo ese presupuesto termina en manos de alguien. Entre los 3259 proveedores que le vendieron a Ñuñoa, unos pocos concentran la mayor parte —sobre todo constructoras de obras—. El tamaño de cada rectángulo es lo que cada uno se llevó.
And not everything is awarded competitively: Ñuñoa es la that buys most through direct contracting in the country — awards without competitive bidding.
Ñuñoa has 5 sedes de educación superior, but first come its schools: 45 of them have students sitting the PAES every year. Which stand out today, and what do their graduates end up studying?
Among the top scores, elite private schools coexist with, notably, the Liceo Augusto D'Halmar and others municipal high schools that rub shoulders with them: Ñuñoa's public education still fights at the top.
Half of those taking the PAES in Ñuñoa enrolls in higher education. Their favorite degree programs are Business, Law and Psychology, and their main destination is Universidad de Chile — followed by UNAB and UC —. A comuna that produces, above all, professionals.
Each comuna is served by a single company, so the quality of Aguas Andinas y Enel — Ñuñoa's utility concession holders — is the quality its residents receive. Set against the rest of the country, one is middle of the pack; the other lived its worst year in 2024.
In the most recent comparable SISS table, from 2017, Aguas Andinas —Ñuñoa’s water utility and the largest in the country, with 1.9 million customers— received 10.3 reclamos por cada 100 clientes: barely above the median (9.6) y en el puesto 13 of 28. Neither the best nor the worst: in service quality, Ñuñoa’s water sat in the middle of the pack.
In 2024, time without power in Chile se multiplicó por 2 —de 13.5 a 27.6 horas promedio por cliente—. Enel, the utility serving Ñuñoa, was at the center of the big blackouts: a single one left 280 mil clientes without power. The comuna that funds itself and starts businesses depends, for the most basic thing, on a service that failed that year like never before.
The water comes from Aguas Andinas and electricity Enel — like almost all of Chile, Ñuñoa depends on regional utilities. It has 5 higher-education campuses within the comuna, 19 documented species in its territory (7 in a conservation category), and its reported crimes fell: 16.565 (2010) → 13.650 (2025).
Todo ese presupuesto, esos permisos y esas obras los decide alguien. Y Ñuñoa fue por décadas un right-wing stronghold: Pedro Sabat governed it for almost twenty years (1996–2015) and his successor, Andrés Zarhi, six more of the same color. Until in 2021 the left flipped the comuna — council 6–3, a Frente Amplio mayor — and in 2024 the result ended tied. The pendulum, election by election, and what its Council resolves month by month.
Since 2015, 479 organizaciones recorded 742 audiencias de Ley del Lobby con la municipalidad. El ranking dice mucho de qué se juega en Ñuñoa: áreas verdes, televisión, movilidad y publicidad en la vía pública.
This whole story spans the last two decades. But the most important part may be the one that hasn't happened yet. INE projections say Ñuñoa will keep growing — toward 359 thousand inhabitants— but, above all, ageing: by 2050, more than a third of its residents will be over 60. The comuna of new towers will be, within a generation, a comuna of the elderly.
Watch how the shape changes: the base narrows — fewer children are born — and the the upper brackets widen. In a decade those over 60 go from 22% to 28% of Ñuñoa, and the trend continues: by 2050 they will be more than a third.
More than 37 de cada 100 vecinos is served by just two CESFAM — Salvador Bustos and Rosita Renard — designed for the Ñuñoa of before. As the comuna ages, those same centers will have to absorb a wave of chronically ill seniors who visit the doctor several times more often than a young person. Ñuñoa's future is not played out only in the towers: it is played out in the CESFAM waiting room.
Ñuñoa's housing stock doubled en dos décadas —de 51.095 viviendas en 2002 a 105.975 en 2024—, pero lo que se construyó no fueron casas para familias: 37% de las viviendas son de un dormitorio o menos and eight in ten are apartments. Just one in four has three bedrooms or more. Ñuñoa filled with spaces designed for living alone or as a couple, not for raising children.
For a decade Ñuñoa had a dozen veterinary clinics, stable. Since 2016 they took off: ×8.2 en menos de veinte años, de 13 a 107. Mientras el total de empresas de la comuna creció 80%, veterinary clinics grew more than 700%. The boom in veterinary clinics is nationwide, so on its own it proves nothing — but it fits the rest: smaller households and fewer children.
That ageing is not an abstract demographic figure: it changes the entire comuna. Beyond healthcare, a growing demand for assisted voting and accessibility at every election; and a local economy that will have to sustain more seniors with low pensions, many of them owners of apartments whose property taxes suben mientras sus ingresos caen. La Ñuñoa que viene tendrá que prepararse para quienes ya viven en las torres.
In 2002 Ñuñoa had as many children as seniors. Today older adults already double them; within a decade they will triple them. The comuna that filled with towers for young families filled, in fact, with departamentos de un dormitorio y hogares sin hijos: today 37% of its homes have one room or less. A comuna like this calls for fewer nurseries and more CESFAM, caregivers and day centers. The question is no longer how much higher it will grow — but who will care for those left in the towers.
Ver la ficha completa de Ñuñoa →